Week 15 & 16: Last week. Goodbye :(

We’ve presented our finals. The video can be found here:

We’ve been thankful for this opportunity to work with awesome people from EA, our instructors and Pittsburgh faculty. We’ve handed off our project to EA and we also talked to the Sims team about the project. Next semester, our friends will continue working on a similar project and we’ve hoped our foundation was strong. On behalf of team TADA. Thank you for reading all my posts so far. See you all very soon!

Week 13 and 14: Softs and final changes

For softs, we implemented a lot of features, including:

  1. Collapsed dots that show videos for the past 30 days and videos for a day.
  2. Axes position change.
  3. Working filters
  4. Improved interaction with dots.

For softs, we received a lot of good feedback and a lot of them are interested in what we have so far. They appreciate the potential of what we did over the course of 12 weeks.

Check it out at tada.etc.cmu.edu

Right now, we’re working to implement more features and changes. We’re also working on team video as well as preparing for showcase next week and a video walkthrough for the faculty.

Week 12: Iteration and Playtest #2

Based on the feedback we have on Monday, we iterated on the webapp and made several changes:

  1. We fixed a lot of bugs, such as video popping up too many times when the user hovers over several dots, and the label feature breaking after several selections.
  2. We also polished the UI according to feedback by having a label bar that can be hidden and headings for each section.


After the changes, we held another playtest session today. We invited 2 guests who work at EA to playtest our game. Both of them are analysts. We received lots of feedback from the playtest, and will highlight some of them here:

  1. The hover view looks nice, but it’s difficult to navigate out of the big circle to view the other small dots.
  2. Wasn’t sure how the label was sorted at the top, possible to sort the labels in a meaningful way.
  3.  VIsual animations of the dots were not meaningful when switching the axes.
  4.  Is it possible to extract data from this interface for other analytics purposes?

A lot of the feedback was on feature improvements that we are looking into. Hence, this solidifies the direction that we should go in.

Here’s one of the playtesters for our product:

The current version of our live website is the one we used for playtest: tada.etc.cmu.edu.

Next week, we’ll consolidate the feedback and begin working on implementing critical improvements/features.


Week 11: Playtest

Hi everyone, we didn’t do a post last week because thought it would be more meaningful if we post after today — our playtest day.

We iterated our UI and interactions multiple times since our Halves prototype. During our playtest, we showed them our current version. Unfortunately, our playtesters couldn’t make it today so we playtested it with the other team internally. Most of the feedback we obtained is targeted on what each section of the UI represents and how we can better display it.

From this picture, we can see how the axes can be sorted (below), how the label heatmaps are displayed (top-left) and how the view count/view-like ratio is displayed as well.

We then asked them several questions based on our target UI mockup. Currently, we are prioritizing the data/video exploration experience over the pinpoint accuracy of data. The label heatmaps show the recency and relevance of labels in the past 30 days. At the bottom, only videos at the top of the assigned Y-axis metric (e.g. popularity) are displayed across the days. The other videos are collapsed and expandable by clicking the bottom circle for each column.


Next, we’ll look to implement further improvements for the prototype.

Week 10: Youtube statistics, meta-labels, React migration & UI changes.


Halves Feedback

A lot of feedback was given to us for Halves. A lot of them is directed towards the usefulness of the product. Users who attended our showcase wanted to see more information with regards to the videos and see more information with regards to the axes on the prototype, such as view count and a zoomable time bar. We also received feedback to be more creative in terms of our visualization, and also ensure that our product is highly functional and usable by our target users – community managers. Currently, it is a huge challenge for us to have a product be highly innovative in terms of visuals without compromising certain functionalities.


This week, we progressed well on several fronts.

Meta-labels

The meta-label feature is designed to categorize collected terms that have the same semantic meaning in the game’s context. For example, “SWBF” has the same meaning as “Star Wars Battlefront” and thus will be categorized under the same meta-label “SWBF”. The stemming process (mentioned one of our previous posts) automatically categorizes English words, and the meta-label is done after stemming to categorize game specific terms with the same meaning together.

Youtube statistics

In preparation for grouping videos according to different criteria, we also looked into parsing Youtube statistics to obtain information such as like counts and view counts.

Twitter mentions

We also implemented twitter parsing to update the latest mentions (One of our Y-axis criteria) of Youtube videos. This gives us more community information on the latest relevant videos despite its upload date.

Front-end

On the front-end, we have spent time migrating it to React to facilitate future developments.

UI

Perhaps our most challenging hurdle to overcome. We have explored and iterated our UI numerously according to feedback. This current UI is our take on the balance between functionality and creativity.


Right now, we’re processing feedback for this interface based on instructors and nailing down components to playtest next week.

Week 9: Halves!

This week, we focused mainly on Halves presentation. Here’s the link to halves!

Right now, we’re working hard to put our prototype up on the web so that Pittsburgh faculty can see it.

We’re also pressing on with UI iterations as we want to finalize it by next week.

Week 8: Preparing for Halves

Halves is around the corner! Meanwhile, the team has been working hard to move forward with developing the prototype.

Current Prototype


This is the current prototype that we have, after database restructuring and stemming of collected labels. We are able to see videos posted for a label, and the frequency of the labels appearing Youtube. An important feedback we receive after showing this prototype is how users interact and customize the groupings themselves. Community Managers will want to pair player taxonomies with their internal one, as well as separate videos under their own metric. Hence, we’re currently working on a meta label feature that categorizes a group of terms together, eliminating duplicate terms with the same meaning in the game’s context. This feature allows users to create their own custom labels and categorize videos their own way.

UI

We have also been working hard on iterating and exploring possible UI options, drawing inspiration from many sources such as knowledge is beautiful,

Currently, we plan to have an overview page that displays aggregate data of the terms, followed by an in-depth page detailing videos posted, as seen in our prototype. Creating an elegant and informative UI to show aggregate data is challenging and thus, we’re constantly iterating and sharing it with our instructors and the client.

We’ll be preparing for Halves from today till Tuesday next week. See you!

Week 7: Rapid UI Iterations, Research and Development

Hi again! This week, we start gearing up for Halves, towards a common understanding of what our product can do and what the UI should be able to display.

We read several papers related to our current goal of aggregating videos and mapping to player defined labels. Here’s a summary of the papers and how they can be relevant:

1. Trend Detection in Social Data, Hendrickson et. al.

The paper discussed mathematical models of detecting trending hash-tags in Twitter posts. We can adopt some of the models discussed in this paper to detect trending terms for Star Wars Battlefront 2 (SWBF2) related tweets. However, given the limited amount of data available for that, the model might be inaccurate.

2. Learning to Hash-tag Videos with Tag2Vec, Singh et. al.

The author described how he was able to train a neural network to learn hash-tag embeddings in a vector space based on a set of training videos and hash-tags.  Then, using Improved Dense Trajectory (IDT) features, the author was able to analyze videos and map the resulting fisher vectors to the tag vectors. This allows us to analyze new videos and map them to an already established tag space. However, the lack of data makes it difficult for us to train the model.

3. Few Example Video Event Retrieval using Tag Propagation, Mazloom et. al.

Here, the neighbor-voting using concept vector features is used to predict possible events (tags) in new videos. Hence, no training data is needed to construct the model to predict the content of new videos. However, the reported accuracy of prediction is still generally low.

Overall, The papers gave us several features that we could implement in our product. More importantly, it gave us an idea of how videos can be mapped to terms/labels in general. Hence, in the next iteration of our product, we will move forward to building video-term mapping, categorization, and term-term relationship.


On the UI side, we created more mockups based on our client’s feedback and shared them:

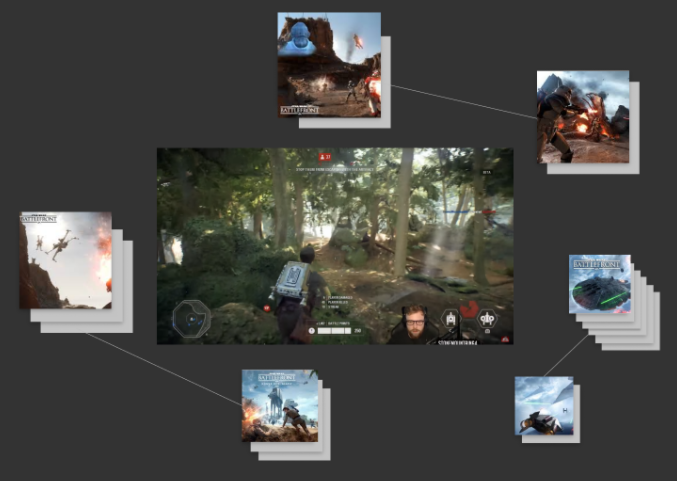
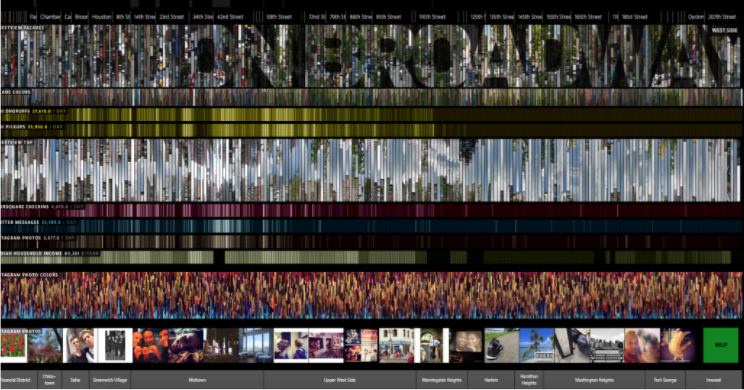
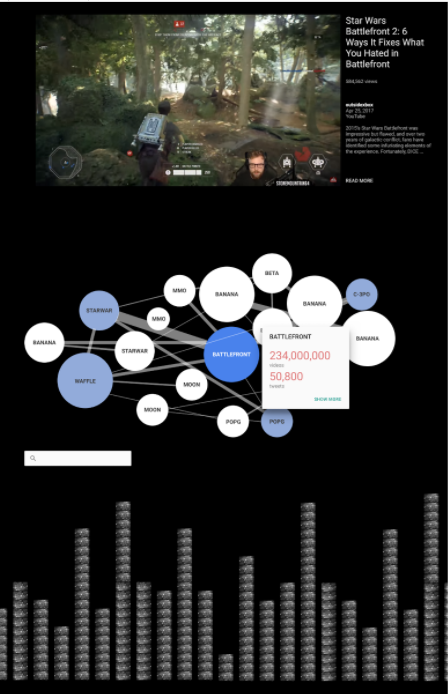
Overall, we received important feedback on the good and bad parts of the three mockups. We also came across http://histography.io/, which will provide us with the main source of inspiration for the next iteration for our UI. The challenge of designing a UI that is interactive, informative and elegant is a huge one for this project.

Next week, we’ll focus on developing our product features and move towards finalizing our UI.


Week 6: Videos by tags

Apologies for the late post! Jiayang and I (Christopher) were away for a conference for the past week.

Last week, we ran the scraper through Battlefront 2’s open beta phase. Right now, we’re still collecting tags and trying to see if they’re meaningful. We also iterated on the interface display according to our client’s thoughts on our prototypes last week.

In this mockup, videos are grouped under map names. This allows for easier cross-comparison of videos between each map, as well as comparisons between each video within each category.

Drawing inspiration from Netflix and other sources, we have several prototypes on how videos can be creatively displayed as well, by using bubbles to form meaningful shapes.

Currently, we are also reading several relevant papers:

  1. Learning to Hash-tag Videos with Tag2Vec, Singh et. al.
  2. Few Example Video Event Retrieval, Mazloom et. al.
  3. Trend Detection in Social Data, Hendrickson et. al.

We’ll consolidate and share, with our client, our findings from these papers and the terms we obtain from the open beta phase this week. The discussion then should solidify our next step.


Week 5: Quarters!

Star Wars Battlefront Video Analyzing

Previously, we used static Star Wars related images and ran them through Google Vision API. We had some success with the “Web Entities” result, which is the collective information of the image and search terms. Google was able to identify iconic content such as the clone trooper or a wookie. The image content detection, however, was not as good. The API was not able to identify Star Wars specific content (Clone Trooper, Darth Vader, etc.). This is understandable as the API was trained using real images.

We tried to analyze Battlefront game videos by running screenshots taken from the videos through the Google Vision API. The results were not promising for both content identification and “Web Entities” since the images are not present on the internet. We discussed this obstacle in our client meeting and decided on trying an alternate way to obtain video tags instead. This time, we look to parse social media (Twitter, Reddit) for Battlefront related terms, hoping that the terms collected can be used to search and tag Battlefront videos.

Data Visualization Research

Meanwhile, we also read a few books on data visualization design (Visualization Analysis and Design by Tamara Munzer, Envisioning Information by Edward R. Tufte). The books educated us on several design principles and strategies we can use to effectively present a set of an information-heavy dataset. To facilitate learning, we shared individual learning points from reading different books with each other.

Quarters

This week, we had our Quarter Walkarounds! A handful of EA employees visited our space and tried out our prototype. Here is our Quarters video:


From the walkarounds, we received a lot of feedback and additional contacts that we could connect with. Next week, we will see if our Reddit/Twitter scraper is effective at collecting relevant Star Wars tags.