
Week 9
We have an answer.
Thanks to a late night conference call with our team and the team from Sky Limit, we now know what we are going to spend the rest of the semester building… Pegasus.
*cheers*
As a team, we were extremely excited to hear that they loved Pegasus as much as we did. We spent the early part of this past week waiting for this phone call and attempting to plan out production schedules for all for the prototypes we made… but we were really just hoping Pegasus would be the ultimate decision. The other two prototypes had their merits, though, as Sky Limit agreed, and we are planning on working some of those design principles into the later iterations of our flying collection game.
During our conversation with them, our clients said they actually gathered and played all of the prototypes we sent in order to really understand them and give us the best feedback they could. We were very fortunate that they did because that made our discussion with them over future ideas really useful because they provided valuable insight based on their own experiences with our world. Without getting too deep into specifics, they gave us great ideas to explore regarding feedback and player-to-player interaction that we are very excited to explore.
With all of that figured out, we spent the last few days of the week setting the stage for and diving into some true project production. We generated user stories that required all sub-teams within the team to collaborate on tasks in order to build out new features to test. We have Playtest Day at the ETC on November 2nd (which you can sign up for here https://www.cmu.edu/etc/cmuplaytesting/become-a-playtester) and that become the “overarching context” for this design sprint. We came up with features that we wanted to put in front of naive guests to see if they work the way we want them to… or work at all.
So look forward to that at the end of next week.
In addition to that path, we also had some other stuff going on in parallel this week.
First, Jue was in Spain at CHIPLAY presenting her and Lai’s project from last semester… and they were an honorable mention in the”Student Game” category. Big congrats to them!
And second, we began to address the biggest point of worry from “Halves” and our playtesting at large… motion sickness.
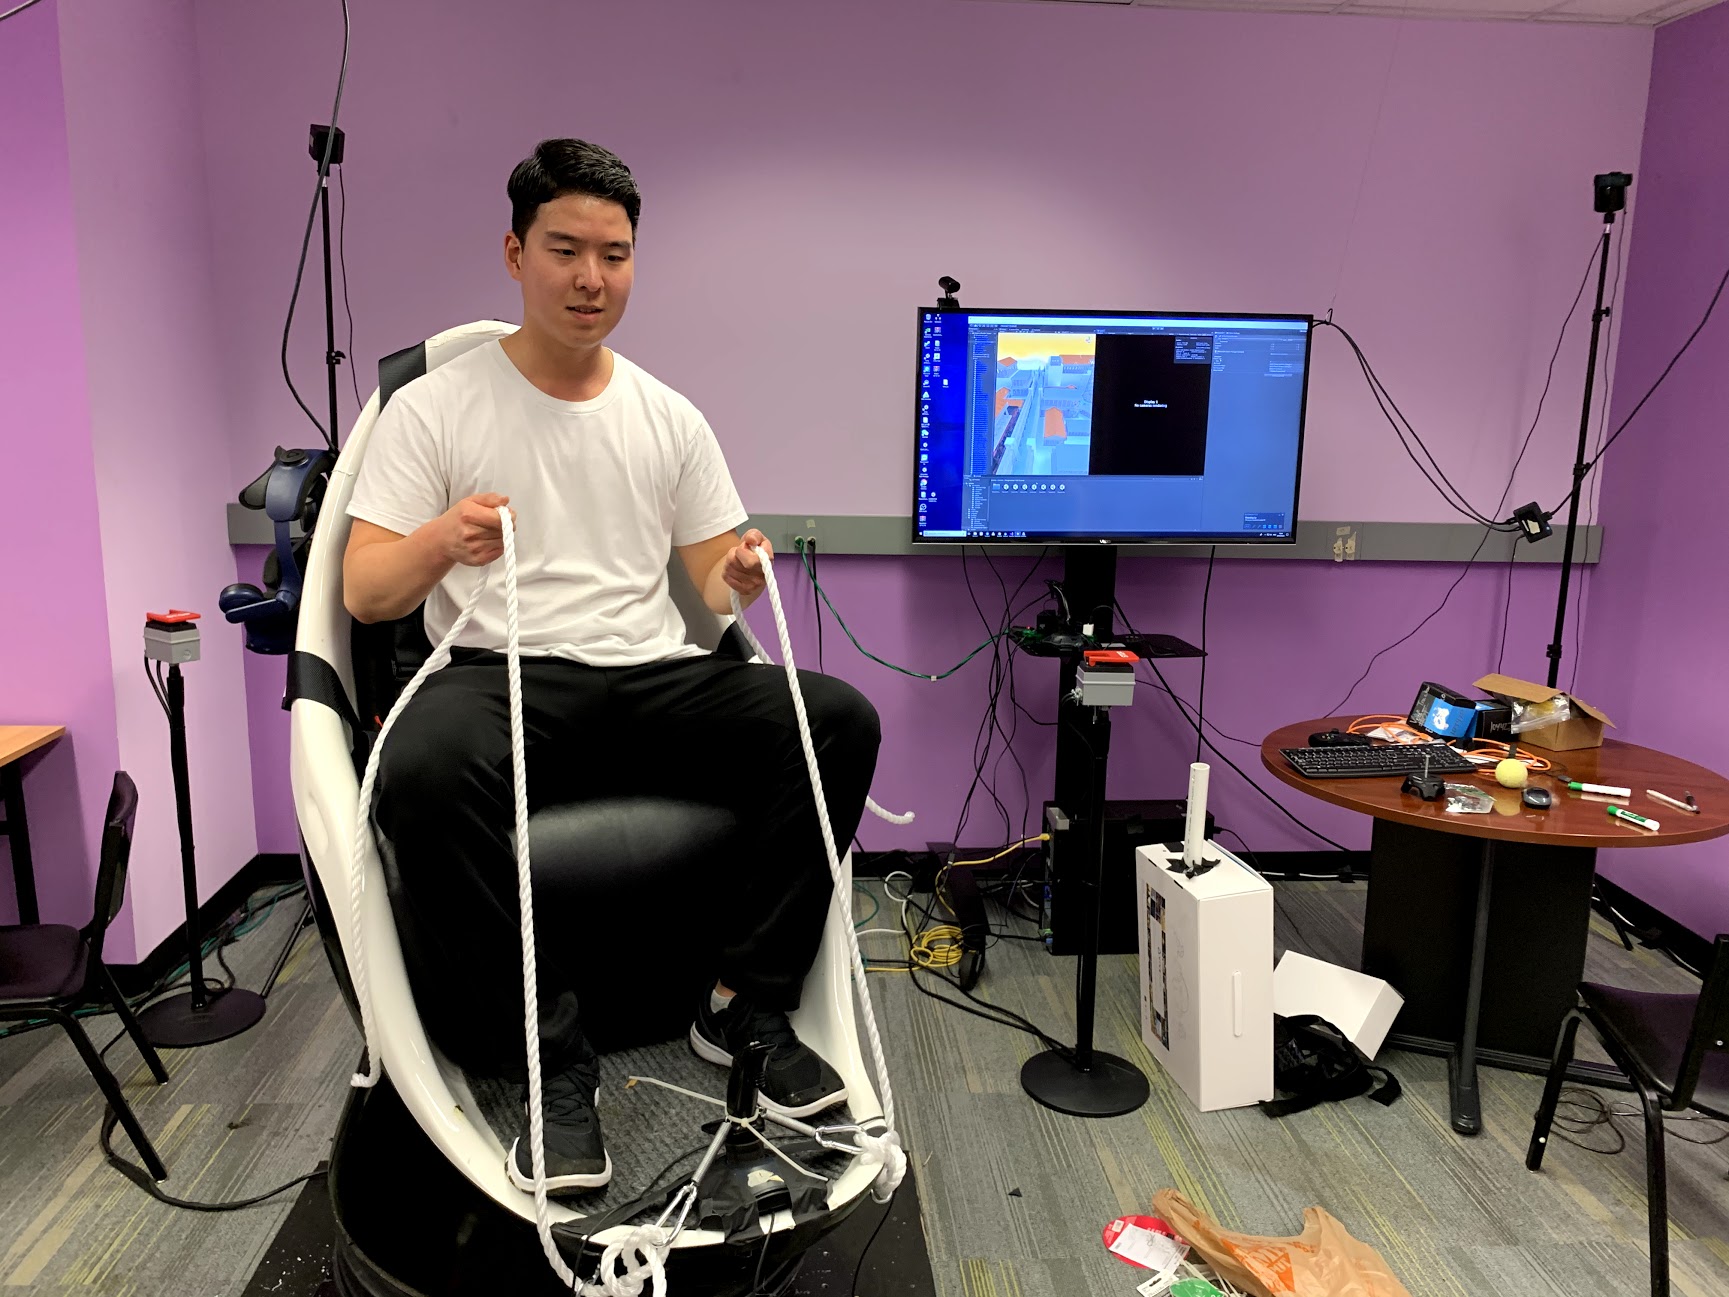
After diving into the academic world of motion sickness research and testing, we decided that it would be beneficial to us to create a database of testers, catalog their propensity to feel motion sickness, and track their reactions to our game over time as we add new features and/or motion sickness solutions. To do that, we created a Pegasus build with no additional motion sickness-reduction strategies – just simple “tilt and fly” mechanics with nothing else. Over the course of the week, we had over 40 playtesters fly around in this experience and we measured motion sickness reactions in the following ways:
- In-game: Fast Motion Sickness Surveys (FMS) – while testers were flying, we would ask them to rate their current level of motion sickness on a scale from 0 (meaning no motion sickness) to 20 (meaning extremely severe motion sickness) every 30 seconds. For general purposes, 1-5 was low motion sickness, 6-10 was moderate, 11-15 was high, and anything past 15 was way worse and we would know quickly.
- First Reactions to Data
- General increase in average FMS score over time
- About half of playtesters “settled” at a score by 90 seconds and then stayed there throughout the rest of the experience
- FMS is great for trends
- First Reactions to Data
- Post-game: Simulator Sickness Questionnaire (SSQ) – testers fill out a survey where they rate how they feel in regards to various motion sickness symptoms (like dizziness, nausea, etc.) on a scale from 0 (none) to 3 (severe). A weighted average of these symptoms then produces a Total Sickness Score.
- First Reactions to Data
- Highest average scores: general discomfort, fullness of head, dizziness with eyes open [but all scores averaged less than a 1 on scale]
- Median rating for over 75% of the symptoms was 0 so half of testers did not feel most of the symptoms
- Symptoms can be sorted into three different sub-factors, of which, “disorientation” was the most noticed
- First Reactions to Data
The scales are not perfect, as self-reporting and scale sizes often lead to some flawed data, but this round of testing gave us a great baseline from which to test future iterations against in multiple ways. Having some statistical analyses to back up our design process will definitely make our final product more appealing to all parties involved.